Deploy WordPress on Kubernetes with monitoring and backups
This tutorial will show you how straightfoward it is, using Helm charts, to have a deployment of WordPress that is monitored and with backups.
You only need a computer with 2 CPUs available to run this as we use Minikube.
Local requirements
Main deployments on the cluster
We will mainly use Helm to deploy applications on the cluster. We will deploy:
- Minio, to have a local object storage for backups (instead of e.g. AWS S3).
- Velero, for handling backups.
- WordPress, the solution we want to deploy.
- The Prometheus stack, for gathering metrics and providing graphs.
Deploying the cluster
Start your cluster with Minikube. At the time of writing, I used Kubernetes 1.19.4:
minikube start --kubernetes-version=v1.19.4
Adding --vm-driver=hyperkit to this command is necessary on macOS due to
Docker networking issues.
Minikube allocates 2 CPUs for Kubernetes by default thus we do not need to specify that.
Deploying monitoring
We will deploy the kube-prometheus-stack which includes Grafana to have dashboards to monitor our cluster easily.
As Helm has deprecated the helm/charts repository,
we add trusted repositories before installing chart archives:
helm repo add prometheus-community https://prometheus-community.github.io/helm-charts
helm install kube-prometheus-stack prometheus-community/kube-prometheus-stack --create-namespace -n monitoring
Setting up backups
We will keep the Velero backups on-premise using a standalone Minio server
deployment. We need some values for the
chart that you can save in a file named minio.yaml:
accessKey: minio
secretKey: minio123

defaultBucket:
  enabled: true
  name: velero

resources:
  requests:
    memory: 1Gi

service:
  type: NodePort
  nodePort: 30002
This will make Minio accessible using known keys, with a default bucket ready for velero and a NodePort making it accessible from your machine. The resource request is just here to not have Minikube taking too much RAM on your machine.
Install Minio after adding its repository:
helm repo add minio https://helm.min.io/
helm install minio -f minio.yaml minio/minio --create-namespace -n velero
Accessing Minio
Get the service URL and access it using your browser:
minikube service --url minio -n velero
The login and password are minio and minio123. We don’t need to do anything
on the Web UI as the velero bucket has already been created using custom
values provided when installing and readable in helm-values/minio.yaml.
Deploying Velero for backups
Velero will need credentials to access Minio, create a file called
minio.credentials with these values:
[default]
aws_access_key_id = minio
aws_secret_access_key = minio123
We install Velero while making it think that we are using AWS S3 (even though
we use Minio). We use the flag --use-restic to backup all pod volumes without
needing annotations (this might not be what you want to do in production) and
we set the --snapshot-location-config to not face this issue.
velero install \
    --provider aws \
    --use-restic \
    --plugins velero/velero-plugin-for-aws:v1.0.0 \
    --bucket velero \
    --secret-file ./minio.credentials \
    --backup-location-config region=minio,s3ForcePathStyle=true,s3Url=$(minikube service --url minio -n velero) \
    --snapshot-location-config region="default"
Deploying WordPress
We will create a WordPress instances in its own namespace.
We need very few Helm values to have a WordPress deployment that is accessible from Minikube locally and monitored:
service:
  port: 7121

metrics:
  enabled: true
  serviceMonitor:
    enabled: true
Save these values in a file called wordpress.yaml. Many other values
are available to customize your WordPress deployment.
We follow the deprecation help and use the Helm chart hosted by Bitnami instead.
helm repo add bitnami https://charts.bitnami.com/bitnami
helm install wordpress -f wordpress.yaml bitnami/wordpress --create-namespace -n wordpress
The deployments take quite some time, use kubectl get pods -A -w to wait until
all the pods are running:
$ kubectl get pods -A
NAMESPACE     NAME                                                        READY   STATUS    RESTARTS   AGE
kube-system   coredns-f9fd979d6-6nzfd                                     1/1     Running   0          8m37s
kube-system   etcd-minikube                                               1/1     Running   0          8m43s
kube-system   kube-apiserver-minikube                                     1/1     Running   0          8m43s
kube-system   kube-controller-manager-minikube                            1/1     Running   0          8m43s
kube-system   kube-proxy-s4flf                                            1/1     Running   0          8m37s
kube-system   kube-scheduler-minikube                                     1/1     Running   0          8m43s
kube-system   storage-provisioner                                         1/1     Running   0          8m43s
monitoring    alertmanager-kube-prometheus-stack-alertmanager-0           2/2     Running   0          7m38s
monitoring    kube-prometheus-stack-grafana-6d9fd5f64b-j4dmw              2/2     Running   0          7m54s
monitoring    kube-prometheus-stack-kube-state-metrics-5cf575d8f8-ghnwn   1/1     Running   0          7m54s
monitoring    kube-prometheus-stack-operator-656797786f-475xv             1/1     Running   0          7m54s
monitoring    kube-prometheus-stack-prometheus-node-exporter-45rkp        1/1     Running   0          7m54s
monitoring    prometheus-kube-prometheus-stack-prometheus-0               2/2     Running   1          7m38s
velero        minio-56bdbcb947-9tzhb                                      1/1     Running   0          6m26s
velero        restic-2r2wj                                                1/1     Running   0          3m50s
velero        velero-5f84bb95c-rdqmc                                      1/1     Running   0          3m50s
wordpress     wordpress-5c7f4bc64-85p6r                                   2/2     Running   1          2m48s
wordpress     wordpress-mariadb-0                                         1/1     Running   0          2m48s
Accessing WordPress
As we use Minikube, we need a route to services deployed with type LoadBalancer by starting a tunnel in another tab of a shell:
minikube tunnel
Get the information needed to access the first instance of WordPress:
export SERVICE_IP=$(kubectl get svc --namespace wordpress wordpress --template "{{ range (index .status.loadBalancer.ingress 0) }}{{.}}{{ end }}")
echo "WordPress URL: http://$SERVICE_IP:7121/"
echo "WordPress Admin URL: http://$SERVICE_IP:7121/admin"
echo Username: user
echo Password: $(kubectl get secret --namespace wordpress wordpress -o jsonpath="{.data.wordpress-password}" | base64 --decode)
You can then access WordPress using the information returned.
Testing monitoring
Everything is set up out of the box to have basic monitoring with the Prometheus stack, we just need to access Grafana:
kubectl port-forward service/kube-prometheus-stack-grafana -n monitoring 7000:80
Now we can login to Grafana (login and password are admin and prom-operator)
by browing http://127.0.0.1:7000/ locally.
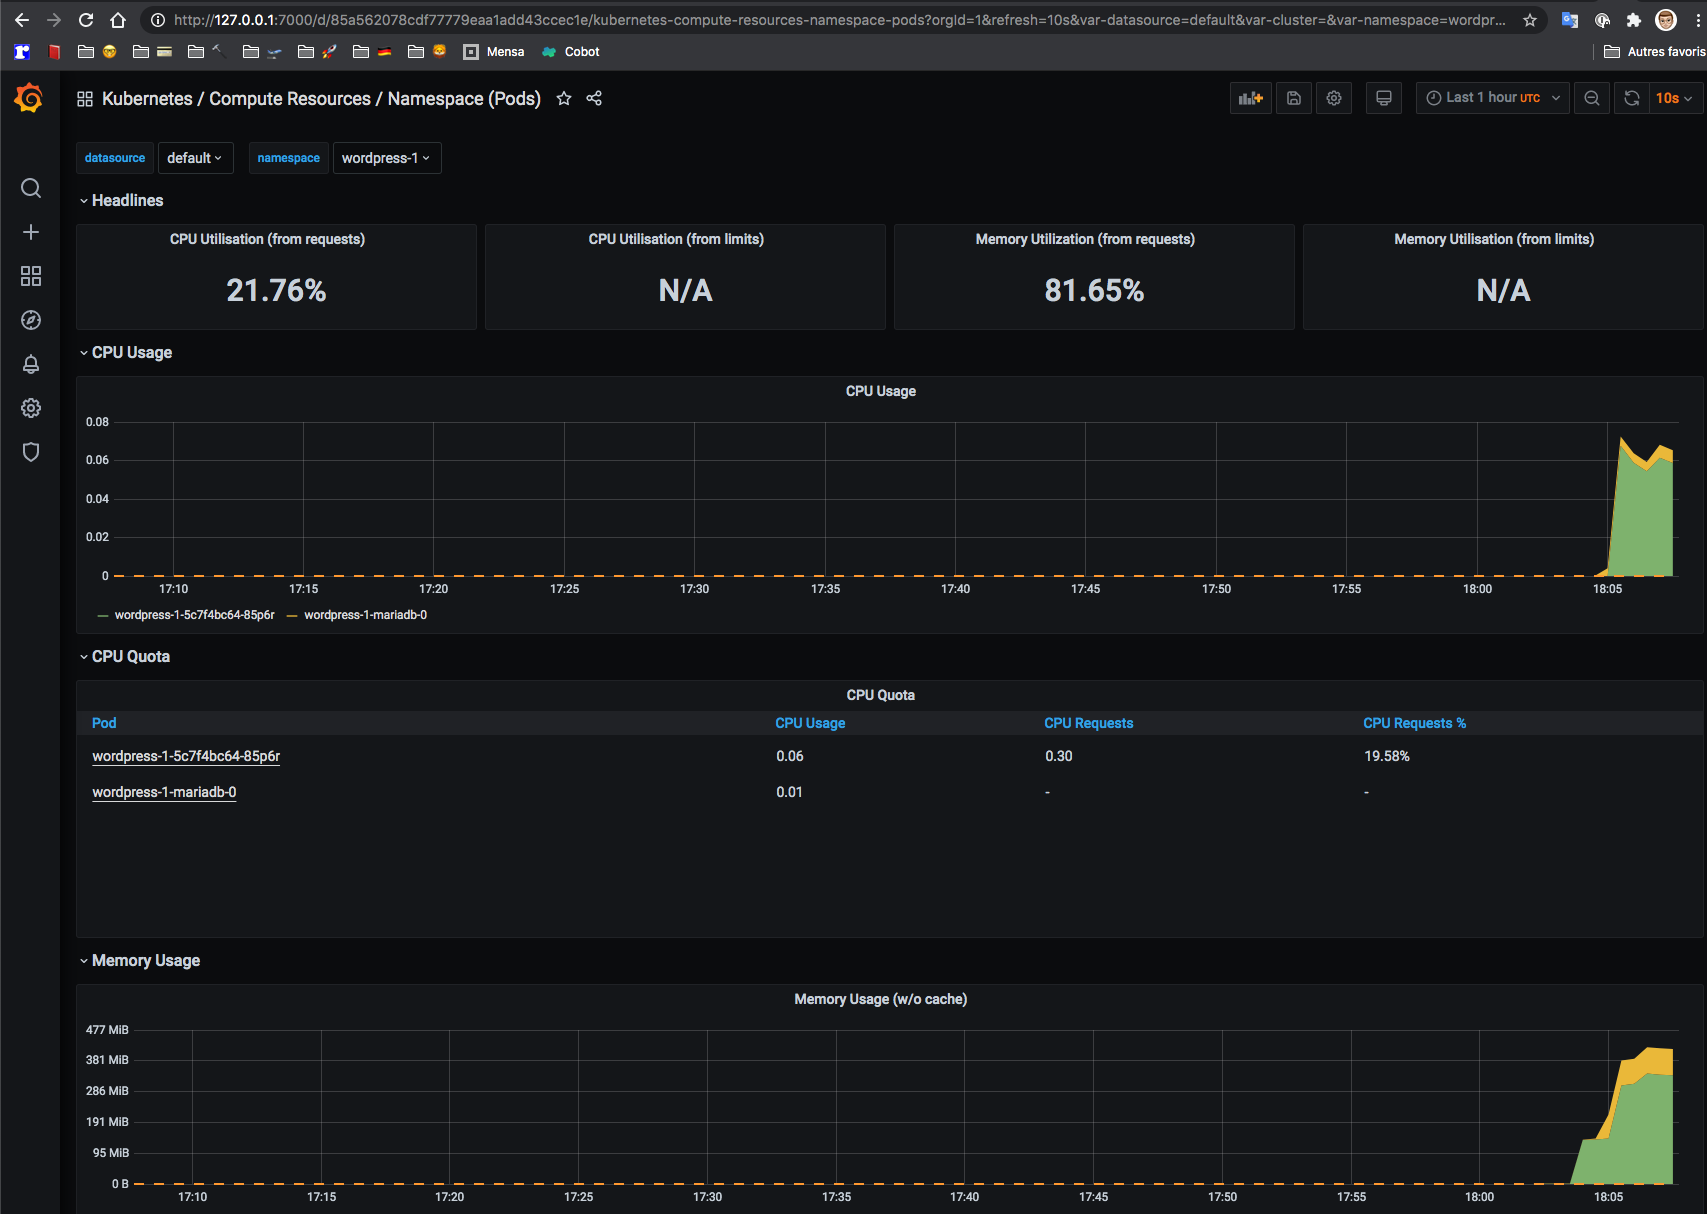
From there, we can access a graph showing memory and CPU metrics at the
namespace level which is what we want with our setup (Dashboards => Manage
=> General => Kubernetes / Compute Resources / Namespace (Pods)).
We also have access to metrics from WordPress that we can use in custom dashboards.
Testing backups
Using the ids from the commands described in the section “Accessing WordPress”, access the admin interface and create a post.
Once this is done, create a backup of the wordpress namespace using Velero:
velero backup create wordpress --include-namespaces wordpress
Uninstall WordPress using helm uninstall wordpress -n wordpress and confirm
that the WordPress-related resources have been deleted using kubectl.
Run velero restore create --from-backup wordpress to recover and, after seeing
all the pods running, run kubectl get svc --namespace wordpress wordpress --template "{{ range (index .status.loadBalancer.ingress 0) }}{{.}}{{end}}"
to get the new IP used by the WordPress deployment.
Browse to http://<wordpress-ip>:7121 and check the post created previously is
still there. This, combined with the output of velero restore describe, can
give you confidence that the backup succeeded.
Conclusion
This setup mainly uses sane defaults which are provided by known Helm charts.
Many things would need to be done to use this in production, such as:
- Storing the backups on an external service (e.g. AWS S3) instead of on-prem.
- Having custom graphs on Grafana to see at a glance metrics about WordPress.
- Securing public access using Traefik or another solution.
And of course, provisioning the cluster outside of Minikube!